PredPreyGrassContinuous
A continuous-space counterpart of PredPreyGrass: the same predator–prey–grass ecosystem, with energy, reproduction and a sparse reward for births, rebuilt in an arena where animals move with physics instead of hopping between grid cells. The code is in the PredPreyGrassContinuous repository, and every training run is recorded in its experiment logs.
Key findings
- In every tournament of the first ecosystems (static grass, moving grass, predators seeing grass), prey kept adapting for thousands of iterations while predators stopped improving after a few hundred: newer prey were harder to catch in 96–98% of pairs, newer predators caught more in only 32–55%.
- The predators' plateau sat at energy break-even, about 8 catches per predator per 1,000 physics steps, in every run and with scripted pursuit strategies alike.
- Letting predators see grass, as they can in PredPreyGrass, raised their catch rate by 34% against the same prey, but only once: they reached the new ceiling within 400 iterations, and the prey caught up.
- A movement cost favours whichever species moves least. Predators, which wait more, starved less as the share of the cost paid for movement rose, and coexistence fell from 40 of 50 episodes (no movement cost) to 33, 11 and 1 of 50 at 10%, 25% and 50%. Running animals spend 80–90% of their energy on movement (Taylor, Heglund and Maloiy, 1982).
- With such a realistic movement cost, predators became ambushers: stopped about half the time, mostly at the grass, lunging at prey that came to eat. Faster prey hardly helped, since against an ambush, speed matters less than seeing the danger in time.
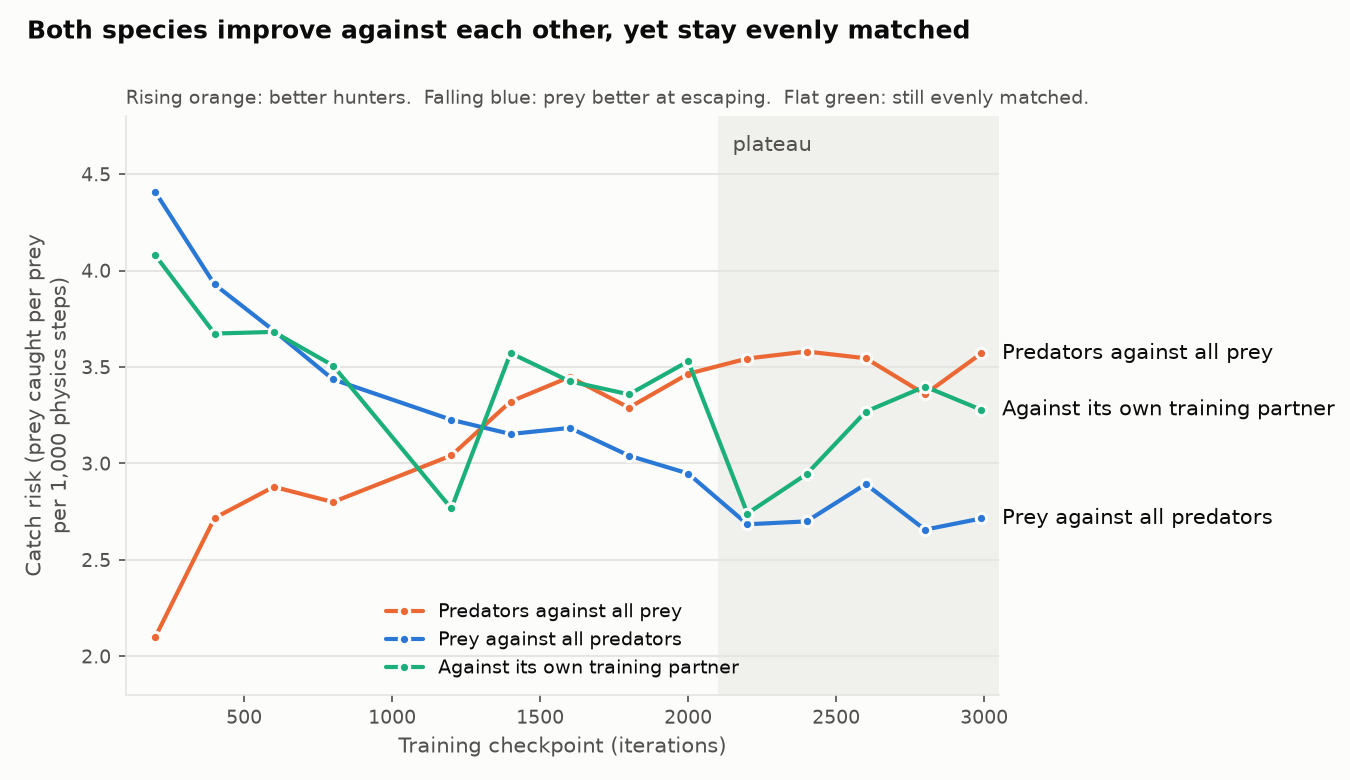
- Spreading the same grass over 20 small clusters instead of 5 large ones broke the ambush (coexistence 43 against 31 of 50, reproduced in two repeat runs with 44 and 42 of 50) and produced the longest arms race: both species improved against each other for about 2,000 iterations while staying evenly matched, then levelled off with both alive in 40 of 50 episodes. Two runs trained from scratch in the same world reached the same state (37 and 41 of 50).
- Making a catch a contest between the summed energy of nearby predators and the prey's energy produced the first arms race: over 1,500 iterations newer predators beat older ones in 88% of tournament pairs and newer prey in 78%. It did not last: the predators, now the struggling species, then degraded (30%), although they attacked together more and more often (20% of attacks, against 7% by chance). With a little more energy per catch, the predators stayed viable and made 64% of their catches in groups, but both species stopped improving after about 1,800 iterations, and the predators teamed up more often in general rather than specifically against the strong prey for which it pays.
From grid to continuous space
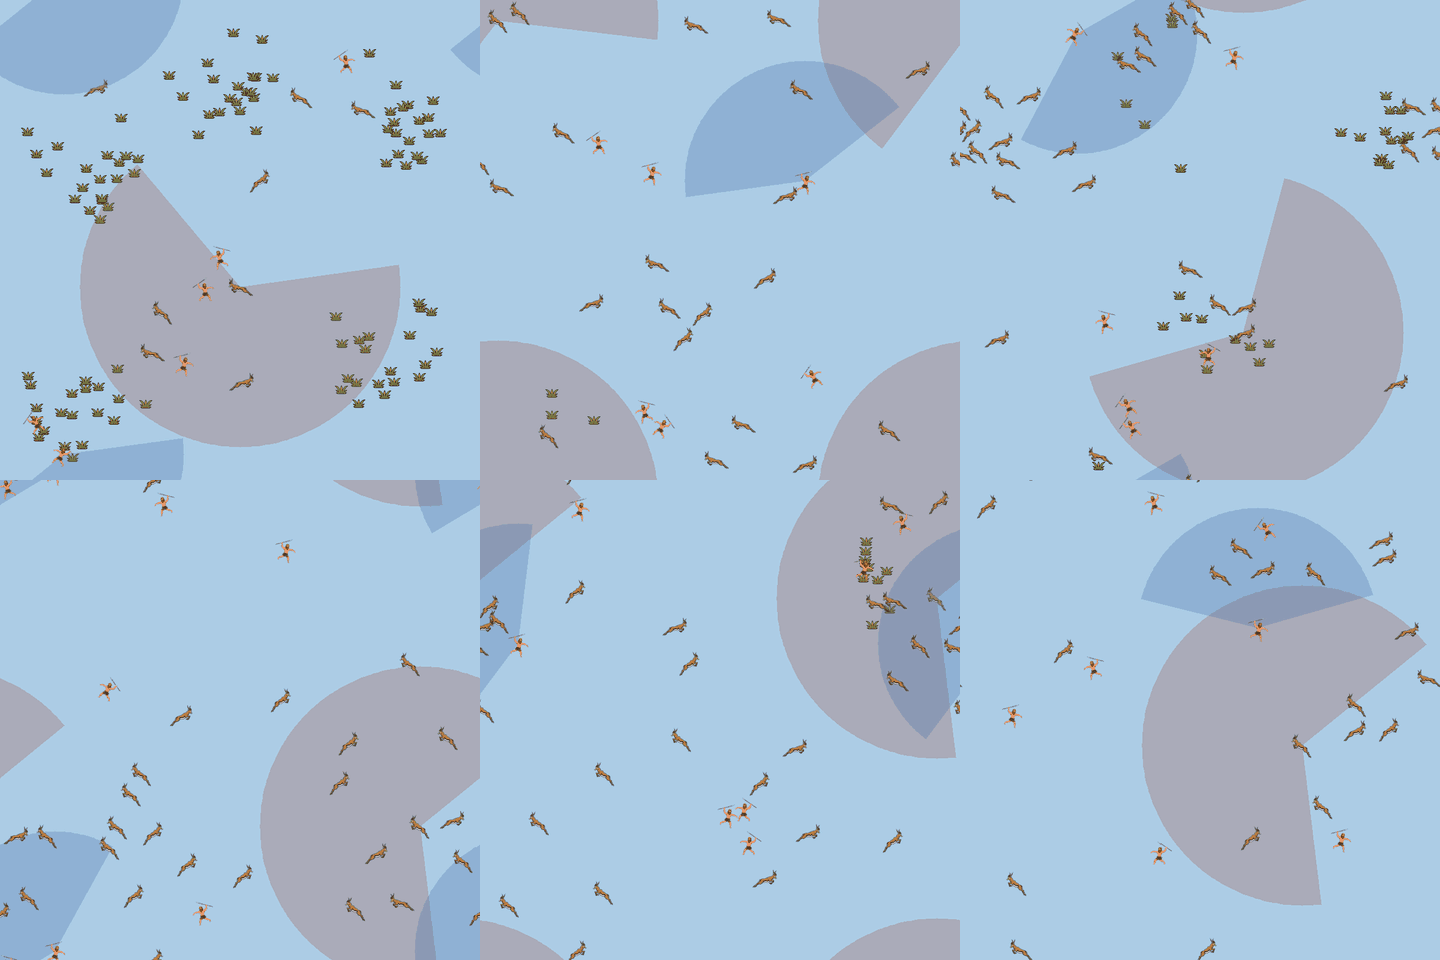
The environment is built on Aquarium, a physics-based predator–prey environment, and trained with Proximal Policy Optimization (PPO), one shared policy per species, using RLlib. Animals have position, velocity and limited acceleration and turning; a predator catches a prey when their bodies touch. Each animal sees through a view cone (predators 150°, prey 240°) and observes the nearest animals and grass patch in it, relative to itself.
The PredPreyGrass rules are carried over as directly as the change of space allows:
| PredPreyGrass (grid) | PredPreyGrassContinuous |
|---|---|
| 25 × 25 grid, one cell per step | 800 × 800 arena; one grid cell ≈ 32 units ≈ 8 physics steps |
| 1,000-step episodes | 8,000 physics steps; one decision lasts 8 physics steps |
| Energy decay, gain from grass and prey | The same energy units, per-step rates divided by 8 |
| Reproduction at an energy threshold | The same thresholds; the offspring is paid from the parent's energy |
| Reward only for reproducing (+10) | The same sparse reward |
| Grass regrows in place | Grass grows in clusters that drift by seed dispersal and die back when overgrazed |
Extensions, step by step
The repository adds one mechanism at a time, each in its own module, so every change can be compared with the world before it:
| Module | Adds |
|---|---|
add_grass | Grass patches that prey eat and that regrow |
add_energy | Metabolic energy, food, starvation |
add_reproduction | Births at an energy threshold, the +10 birth reward, moving grass clusters, predators that see grass |
add_walls | Walls that block movement and sight; actions at full speed, half speed or stopped |
add_group_hunting | Every animal's energy visible to others; catches as a contest between hunters and prey |
Movement energy
With speed actions, an animal can stop and wait, which made it natural to charge energy for movement. For animals on land, metabolic power rises roughly linearly with running speed (Taylor, Heglund and Maloiy, 1982), so the movement cost was made linear in speed, on top of a resting cost. The share of the cost paid for movement turned out to decide which species wins. A series of runs, each continuing the same trained policies, raised that share step by step: the more of the cost depended on movement, the more the predators gained, because they move slower than prey on average and wait at the grass, so the same behaviour simply became cheaper for them. Prey, which have to run to escape, saved little. Taylor, Heglund and Maloiy's measurements put the realistic share for a running animal at about 80–90% (running costs roughly 5 to 10 times as much as resting), far above the shares where the prey already collapsed. A realistic movement cost therefore only works together with other features of a realistic ecology, which the results below explore.
Group hunting
In the group-hunting module, a predator that touches a prey attacks, and succeeds with probability
where is the summed energy of all predators near the prey, the prey's energy, the prey's strength and the steepness: a contest success function (Tullock, 1980). A successful catch is shared equally among the hunters, and a failed attacker must wait before attacking the same prey again. Nothing forces cooperation: a lone predator can still catch, just less often. With , teaming up pays against strong, well-fed prey and not against weak ones, so predators would have to learn when to hunt together.
Results summary
| Experiment | Outcome after training |
|---|---|
| Moving grass, predators blind to grass (3,000 iterations) | Both species alive at the end in 8 of 20 episodes |
| Predators see grass (4,000 iterations) | 10 of 20; catch risk 2.93 prey per prey per 1,000 steps |
| Walls, speed-dependent movement cost (3,000) | 0 of 20; prey extinct, catch risk 8.13 |
| Walls, fixed cost (3,000) | 1 of 20; catch risk 5.62 |
| No walls, speed actions, fixed cost (3,000) | 11 of 20; catch risk 3.02 |
| The same, continued to 4,000 | 17 of 20; catch risk 2.57 |
| The same, continued to 4,000 with a gentle movement cost | 14 of 20; catch risk 2.76 |
| Every animal's energy visible (1,000) | 0 of 20; catch risk 7.51, against 4.84 without |
| Group hunting, catch shared, half energy per catch (3,000) | Predators extinct in 20 of 20; catch risk 0.68; predators best at iteration 1,500 |
| Group hunting, three quarters of the energy per catch (3,000) | Prey extinct in 20 of 20; catch risk 5.29; 64% of catches made in groups |
Tournaments, in which every predator checkpoint plays every prey checkpoint, separate adaptation from chance: if newer prey are harder to catch for a fixed predator, the prey are adapting, and vice versa. Co-adaptation needs both shares clearly above 50%.
| Experiment | Newer prey harder to catch | Newer predators catch more |
|---|---|---|
| Predators see grass (4,000 iterations) | 96% | 43% |
| Walls, fixed cost (3,000) | 83% | 60% |
| No walls, speed actions, fixed cost (3,000) | 89% | 55% |
| Group hunting, iterations 300–1,800 | 78% | 88% |
| Group hunting, iterations 1,800–2,990 | 48% | 30% |
| Group hunting, three quarters energy, iterations 300–1,800 | 73% | 74% |
| Group hunting, three quarters energy, iterations 1,800–2,990 | 54% | 48% |
Did the predators learn to team up against strong prey?
Teaming up pays only against well-fed prey, so purposeful cooperation would show as more company at attacks on strong prey. Predators also gather near grass, where prey are well fed, so the same link can arise without cooperation. The trained group hunters (three quarters energy per catch) were therefore compared with a control: predators never trained with group hunting, played in the same world, 20 episodes each.
| Attacks with a second predator within 64 units | Trained group hunters | Control |
|---|---|---|
| All attacks | 49% | 34% |
| Against the weakest quarter of prey | 42% | 27% |
| Against the best-fed quarter of prey | 56% | 42% |
| Increase per unit of prey energy (log-odds) | +0.14 | +0.15 |
Both groups attack well-fed prey with company more often, and by the same amount, so that link comes from where predators and well-fed prey meet. The trained predators have learned to hunt in company more often overall, by about 15 percentage points, but not selectively against the prey for which it pays.
Realistic movement costs: ambush and spread-out food
With 75% of the cost from movement, predators stopped about half the time, mostly at the grass, and lunged at prey that came to eat: 87% of catches happened with the predator running, 70% near grass. Prey 10% or 20% faster than predators did not stop this. Spreading the same 100 grass patches over 20 small clusters instead of 5 large ones did, because predators can no longer wait at all the food. All runs below continue already trained policies for 1,000 iterations without walls: the first six from the healthiest earlier ecosystem, the last two, side by side, from the run with 75% and prey speed 6.0. Final checks use 50 episodes.
| Share of cost from movement | Prey top speed | Grass | Both alive | Prey extinct | Predators extinct |
|---|---|---|---|---|---|
| 0% | 5 | 5 clusters | 40 of 50 | 7 | 3 |
| 10% | 5 | 5 clusters | 33 of 50 | 12 | 5 |
| 25% | 5 | 5 clusters | 11 of 50 | 37 | 2 |
| 50% | 5 | 5 clusters | 1 of 50 | 49 | 0 |
| 25% | 5.5 | 5 clusters | 15 of 50 | 0 | 35 |
| 75% | 5.5 | 5 clusters | 21 of 50 | 29 | 0 |
| 75% | 6.0 | 5 clusters | 31 of 50 | 19 | 0 |
| 75% | 6.0 | 20 clusters | 43 of 50 | 6 | 1 |
Two repeats of the 20-cluster run, from the same start but with new training randomness, reproduced it closely: both species alive in 44 and 42 of 50 episodes, against 43 in the first run and 31 in the control; pooled 129 of 150 against 31 of 50, very unlikely by chance (p < 0.001). In all three, predators waited less and away from the grass, and both species improved against each other in the tournaments. Two further runs trained the same world from scratch, without any inherited policies, for 3,000 iterations: they reached the same state (both species alive in 37 and 41 of 50 episodes) with the same behaviour and the same pattern of mutual improvement followed by a plateau.
Continued for another 2,000 iterations, the world with spread-out grass gave the longest arms race in these experiments. A tournament over all 3,000 iterations shows both species improving against each other for about 2,000 iterations, the predators by about 70% in catch effectiveness and the prey by about 40% in escape, while each checkpoint against its training partner stayed level. After about 2,200 iterations neither side improved further.
| Checkpoints | Newer prey harder to catch | Newer predators catch more |
|---|---|---|
| 200–800 | 96% | 79% |
| 1,200–2,000 | 70% | 82% |
| 2,200–2,990 | 36% | 40% |
Population dynamics within an episode
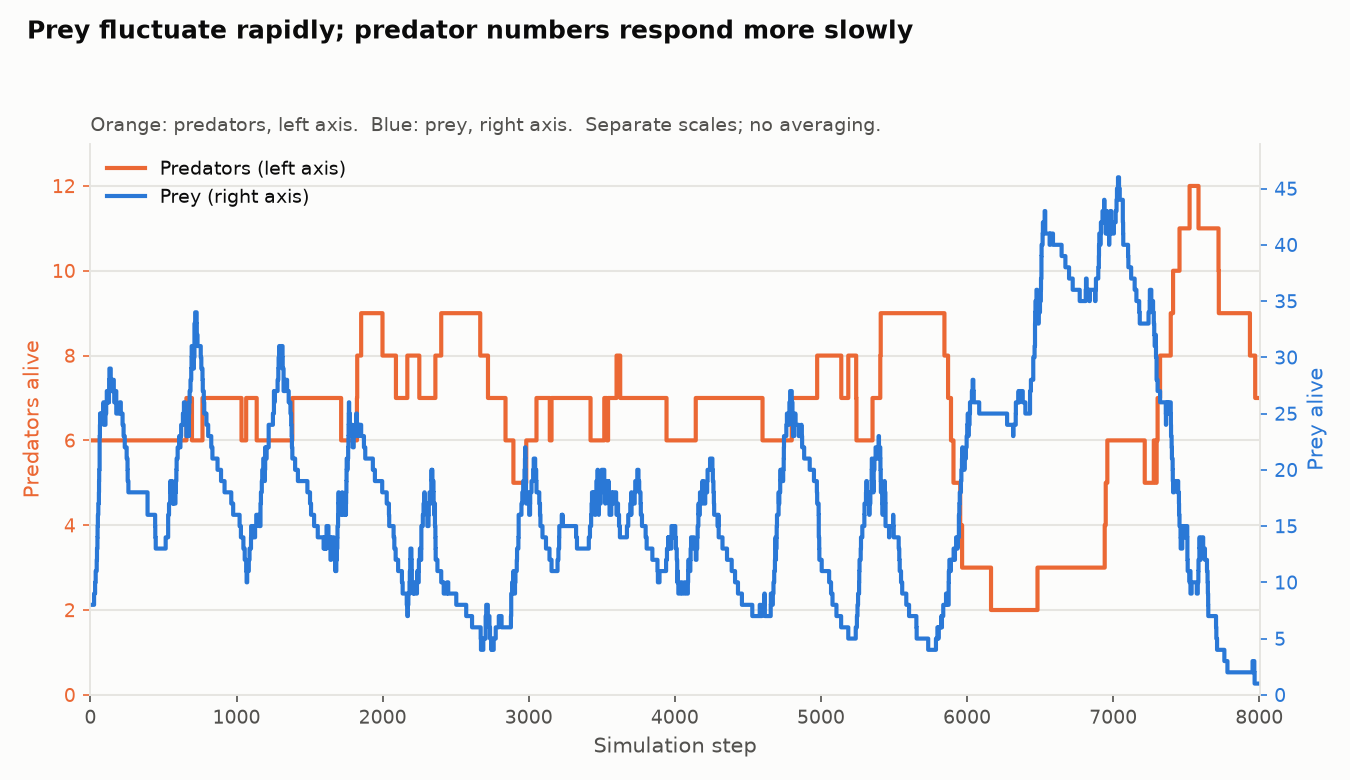
The populations show irregular predator–prey oscillations resembling a Lotka–Volterra pattern: prey can grow when food is available and predator numbers are low, while predator growth follows successful feeding. Near the end of this episode, prey peak around step 7,000 and predators around step 7,500. Grass availability, energy reserves, starvation and threshold-based reproduction modify the feedback; this single rollout does not establish a classical Lotka–Volterra cycle.
Prey turn over much faster than predators. The saved first evaluation episode for this checkpoint recorded 458 prey births and 449 catches, compared with 36 predator births and 35 predator starvation deaths. Prey feed directly on grass; predators receive 50% of a caught prey's energy and reproduce at an energy threshold of 12, versus 8 for prey. Energy reserves delay predator starvation after prey decline. Predator counts therefore change less often, even while individual predators are replaced. They still range from 2 to 12 in the plotted rollout, compared with 1 to 46 prey: a sixfold predator change, so their smaller absolute swings should not be mistaken for constant numbers.
Summary
The prey were always the faster learners, until the ecology changed. In the first worlds, prey kept refining their escape for thousands of iterations, while predators settled at the catch rate that just pays for their metabolism. More predator information (grass, the energy of others) or harder prey (faster prey, walls) shifted where that plateau lay, but did not give predators anything to keep improving.
The ecology decides more than the learning does. Whether the two species keep improving against each other was set mainly by the energy economics and the layout of the food. A movement cost favours the slower species: predators that wait at the grass pay less, starve less and wipe out the prey. Where food is concentrated in a few places, waiting there is enough; where it is spread out, predators have to hunt.
A realistic combination produced the longest arms race. Realistic movement costs, food spread over the landscape and prey a little faster than their predators together gave the healthiest and most dynamic ecosystem: both species improved against each other for about 2,000 iterations while staying evenly matched, the Red Queen pattern, before levelling off. This mirrors ecology, where ambush predators thrive at waterholes and much less in open grazing land.
Group hunting gives predators a skill that can grow, for a while. When a catch depends on how much strength predators bring together, a single lunge is no longer enough, and predators did learn to attack together, but in general rather than specifically against the strong prey for which it pays; how much energy a catch yields decided whether predators boomed, collapsed or reached a standoff.
Open questions. Most results come from a single training run. The central one is the exception: the world with realistic movement costs, faster prey and spread-out food gave the same healthy state in five runs, three from the same starting point and two trained from scratch, each with both species improving against each other before levelling off. Even the best race eventually levels off: memory, cooperation among prey, or persistence hunting, in which predators wear prey down over long chases, are candidates for keeping it going.
References
- Kölle, M., Erpelding, Y., Ritz, F., Phan, T., Illium, S., & Linnhoff-Popien, C. (2024). Aquarium: A comprehensive framework for exploring predator-prey dynamics through multi-agent reinforcement learning algorithms. arXiv:2401.07056. https://arxiv.org/abs/2401.07056
- Schulman, J., Wolski, F., Dhariwal, P., Radford, A., & Klimov, O. (2017). Proximal policy optimization algorithms. arXiv:1707.06347. https://arxiv.org/abs/1707.06347
- Taylor, C. R., Heglund, N. C., & Maloiy, G. M. O. (1982). Energetics and mechanics of terrestrial locomotion. I. Metabolic energy consumption as a function of speed and body size in birds and mammals. Journal of Experimental Biology, 97, 1–21. https://doi.org/10.1242/jeb.97.1.1
- Tullock, G. (1980). Efficient rent seeking. In J. M. Buchanan, R. D. Tollison, & G. Tullock (Eds.), Toward a theory of the rent-seeking society (pp. 97–112). Texas A&M University Press.
- doesburg11. PredPreyGrassContinuous (code and experiment logs). GitHub. https://github.com/doesburg11/PredPreyGrassContinuous